Quality of Experience (QoE) reports are crucial tools in understanding how users perceive their interactions with services, particularly in network management. In this guide, we will delve into the essentials of QoE, break down the structure and components of QoE reports, and explore their influence on business decisions, as well as the future trends shaping this field.
Defining QoE (Quality of Experience)
QoE refers to the overall satisfaction of users when consuming a service, especially in digital environments. It encompasses several subjective and objective factors that define a user’s perceived quality while using a system, application, or service.
By analyzing QoE, organizations can better understand user satisfaction, highlight areas for improvement, and make informed decisions regarding service delivery and optimization. It moves beyond mere technical performance metrics, aiming to capture the holistic view of user engagement. This approach allows businesses to tailor their services to meet user expectations more effectively, fostering loyalty and enhancing brand reputation.
In today’s fast-paced digital landscape, where users have a plethora of options at their fingertips, understanding QoE becomes even more critical. Companies that prioritize QoE not only improve user retention rates but also encourage positive word-of-mouth, which can be a powerful marketing tool. As users share their experiences across social media and online platforms, a strong QoE can lead to organic growth and a loyal customer base.
The Importance of QoE in Network Management
In network management, QoE plays a pivotal role in bridging the gap between technical performance and user satisfaction. Network administrators utilize QoE to monitor how well users accept the quality of the service they receive. The metrics derived from QoE assessments help identify problems in user experience even before they become evident.
This focus on user experience can lead to enhanced network performance and ultimately contributes to better service delivery. Organizations capable of effectively measuring and analyzing QoE can achieve significant competitive advantages by creating superior customer experiences. For instance, proactive adjustments based on QoE data can prevent service disruptions, ensuring that users remain engaged and satisfied with the service provided. This proactive approach not only minimizes churn but also enhances the overall reputation of the service provider in a crowded marketplace.
Key Components of QoE
- User Perception: This includes subjective evaluations directly from users regarding their experiences with the service.
- Performance Metrics: These are objective metrics related to functionality, such as latency, jitter, and bandwidth.
- Environmental Factors: Variables such as user location, device type, and network conditions can significantly impact user perception and experience.
- Application Context: The nature of applications being used also influences QoE; for example, video streaming may have different demands than web browsing.
Additionally, user perception can be influenced by factors such as customer support interactions, the ease of navigation within an application, and the overall aesthetic appeal of the interface. These elements contribute to a user’s emotional response, which can be just as critical as technical performance in determining QoE. Moreover, understanding the application context allows organizations to prioritize enhancements that resonate with specific user needs, ensuring that the service evolves alongside changing user expectations and technological advancements.
The Structure of QoE Reports
QoE reports typically encompass several sections, breaking down the data for easier interpretation and decision-making. Structure is vital for making sense of complex data, and a clear format aids stakeholders in quickly identifying critical insights. Each section is designed to address specific aspects of the user experience, from network performance to application responsiveness, ensuring that no critical detail is overlooked.

Understanding how to read and interpret these reports is essential for network managers and business leaders aiming to enhance user experience and drive performance improvements. By familiarizing themselves with the layout and the types of data presented, decision-makers can more effectively prioritize actions and allocate resources where they are most needed, ultimately leading to a more streamlined operation.
Understanding QoE Metrics
QoE metrics serve as indicators that reflect user satisfaction levels. Common metrics include Mean Opinion Score (MOS), which is a performance rating based on user surveys, and Service Level Agreement (SLA) metrics that are tied to specific performance benchmarks. These metrics are not just numbers; they tell a story about user interactions and perceptions, providing a qualitative layer to the quantitative data.
These metrics allow organizations to assess both current states of service offerings and historical trends, enabling them to predict future performance and make data-driven decisions for enhancements. For example, a consistent decline in MOS over several reporting periods may indicate a need for infrastructure upgrades or a review of customer service protocols, prompting proactive measures before user dissatisfaction escalates.
Interpreting QoE Graphs and Charts
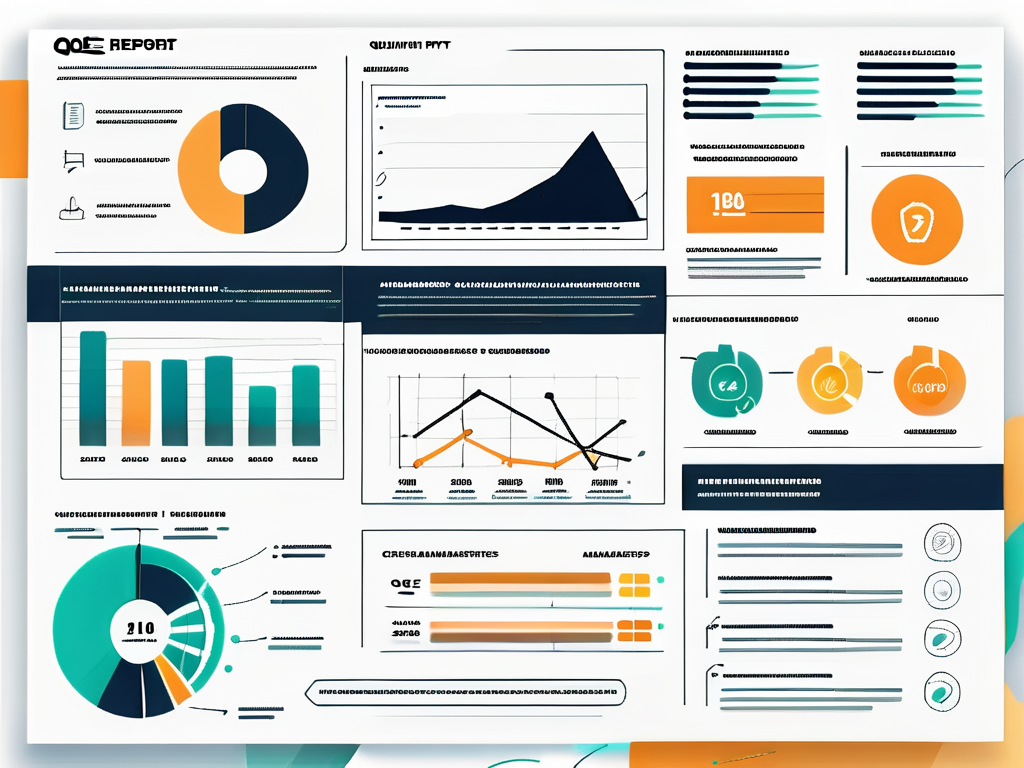
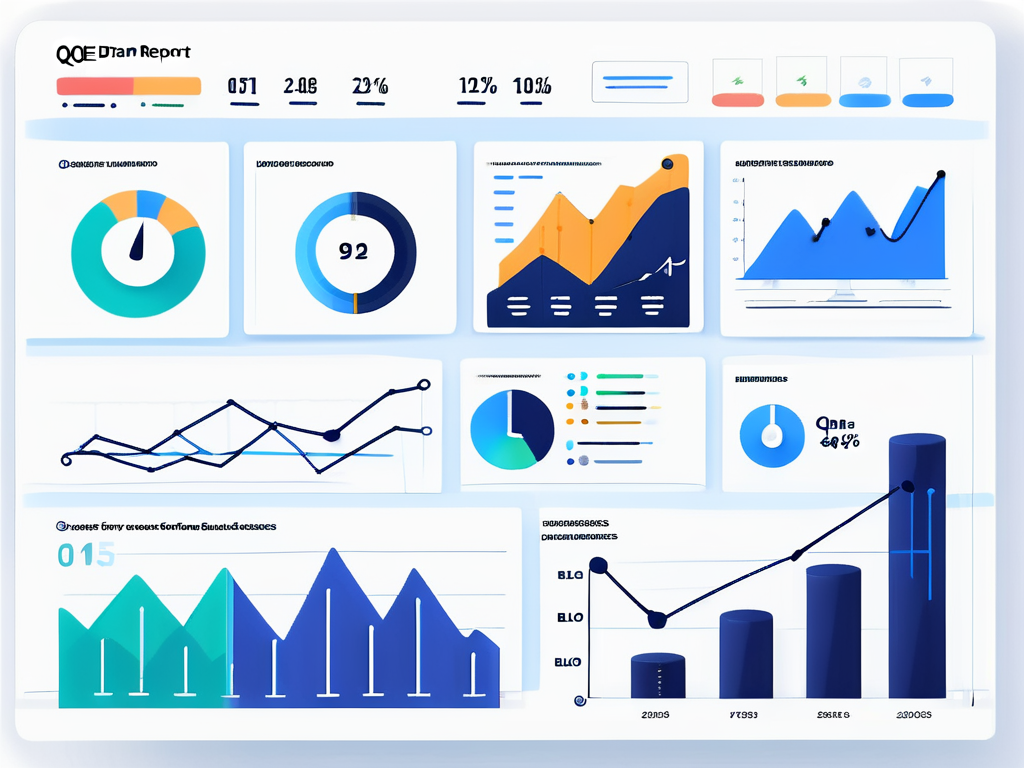
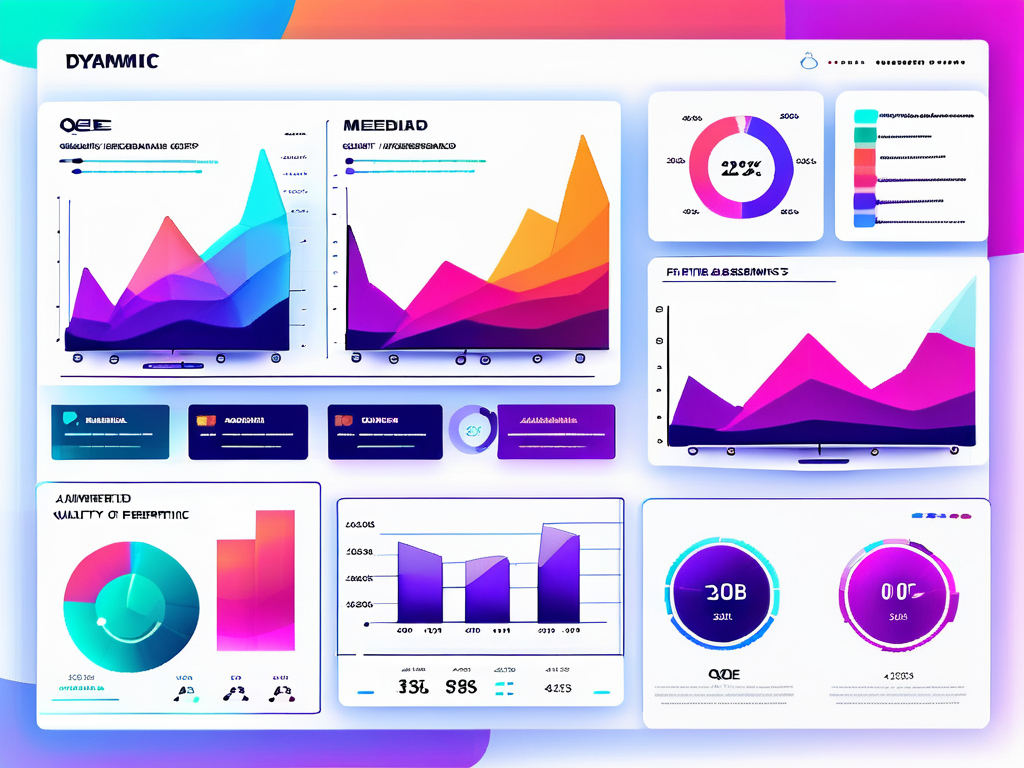
QoE reports often present data visually through graphs and charts, providing an immediate snapshot of performance. However, interpreting these visuals correctly is an essential skill for stakeholders. The choice of graph type—whether a line chart, bar graph, or pie chart—can significantly influence the perception of the data, making it crucial to select the right format for the information being conveyed.
Good interpretation involves understanding what the data represents, looking for patterns, and recognizing anomalies. A steep drop in user satisfaction metrics, for instance, could signal underlying issues that require immediate attention. Additionally, comparing different time periods or user segments within these visuals can uncover trends that may not be immediately apparent, allowing teams to tailor their strategies to specific user needs or operational challenges. By honing their analytical skills, stakeholders can transform raw data into actionable insights that drive continuous improvement in user experience.
How QoE Reports Influence Business Decisions
In today’s fast-paced digital landscape, understanding the influence of QoE reports on business strategy is key. These reports provide data-driven insights that help companies not only to enhance service offerings but also to anticipate user needs.

By prioritizing user experience, businesses can make informed choices that align with customer expectations, ultimately leading to improved loyalty and retention rates. The information gathered through QoE reports becomes a foundational element for strategic planning.
QoE Reports and Customer Satisfaction
Customer satisfaction is directly linked to the quality of service received, which is thoroughly analyzed in QoE reports. When businesses pay attention to QoE insights, they can tailor their services to meet and exceed customer expectations.
This proactive approach means organizations can address pain points before customers even voice concerns, fostering a positive experience and creating stronger customer relationships.
QoE Reports and Network Optimization
Network optimization is another critical area where QoE reports make a significant impact. By identifying areas of poor performance through detailed analysis, organizations can reroute traffic, upgrade infrastructure, and implement necessary revisions to enhance overall performance.
The end goal is a seamless user experience, making networks not only efficient but also capable of handling increased loads and diverse service types effectively.
Common Challenges in Reading QoE Reports
Despite the critical insights provided by QoE reports, interpreting them can come with challenges. Understanding these hurdles can enhance the effectiveness of the analysis process and, subsequently, service improvements.
Addressing common pitfalls is crucial for maximizing the utility of these reports in decision-making processes.
Overcoming Technical Jargon in QoE Reports
One significant issue is the technical jargon often associated with QoE reports. Specialized terms can hinder stakeholder understanding, making it difficult to derive actionable insights.
Organizations can combat this by providing training as well as creating glossaries that translate technical terms into layman’s language. In this way, even non-technical stakeholders can contribute to discussions regarding network performance and improvements.
Addressing Incomplete or Inconsistent Data in QoE Reports
Another challenge lies in the potential for incomplete or inconsistent data, which can skew interpretations and lead to erroneous conclusions. Validating data sources and ensuring consistency is vital; measures must be taken to ensure inputs are both accurate and complete.
To approach this challenge, businesses should routinely review their data collection processes and invest in robust analytics tools that can help identify discrepancies before they impact decision-making.
Future Trends in QoE Reporting
As technology evolves, so does QoE reporting. Understanding emerging trends is critical for staying ahead in network management and ensuring that services remain competitive and aligned with user demands.

Business leaders and network managers should remain vigilant, constantly adapting their strategies as industry standards and user expectations shift.
The Role of AI in QoE Reporting
Artificial intelligence (AI) is beginning to play a transformative role in QoE reporting. AI algorithms can analyze vast amounts of data quickly and accurately, providing deeper insights into user behavior and satisfaction levels.
With predictive analytics, organizations can identify potential issues before they escalate, allowing preemptive measures to maintain high-quality experiences and customer satisfaction.
The Impact of 5G on QoE Reporting
With the rollout of 5G technology, the landscape of QoE reporting is set for significant change. 5G allows for increased data speeds and lower latency, creating opportunities for richer user experiences and more complex applications.
This advancement will necessitate new metrics and methodologies for assessing QoE, as the expectations for service performance continue to grow. Businesses must adapt quickly to leverage the capabilities of 5G while maintaining a strong focus on user experience.
In conclusion, QoE reports are a vital component of network management, influencing decision-making on various levels. As we look toward the future, staying abreast of trends and technologies will be key to delivering outstanding user experiences.
